Campus Reports
2023
Designer:
Luke Taylor
Luke Taylor

At every school with a Marriage Pact match event, we release an annual Campus Report at the end of spring semester. The campus reports share aggregate analyses of the campus at-large, painting a picture of the school community no one else ever could. The reports advance this critical piece of brand identity—Marriage Pact is a non-establishment authority, an in-the-know upperclassman to look up to.
Further, the campus report is our primary recruiting tool for students to join our team. We never ask favors of the campus communities without demonstrating our value first—we deliver a full, unique report to each campus before introducing a hiring call to action.
Further, the campus report is our primary recruiting tool for students to join our team. We never ask favors of the campus communities without demonstrating our value first—we deliver a full, unique report to each campus before introducing a hiring call to action.
 Evolution of the campus report visual style
 Evolution of our heatmap data visualization
The goal of the reports’ design is to support comprehensive data visualization that’s digestible to the average reader and celebrate the unique facets of campus. Prior directions of the campus report were not extensible to work for dozens of (very different) campus communities, and relied on print-optimized design.
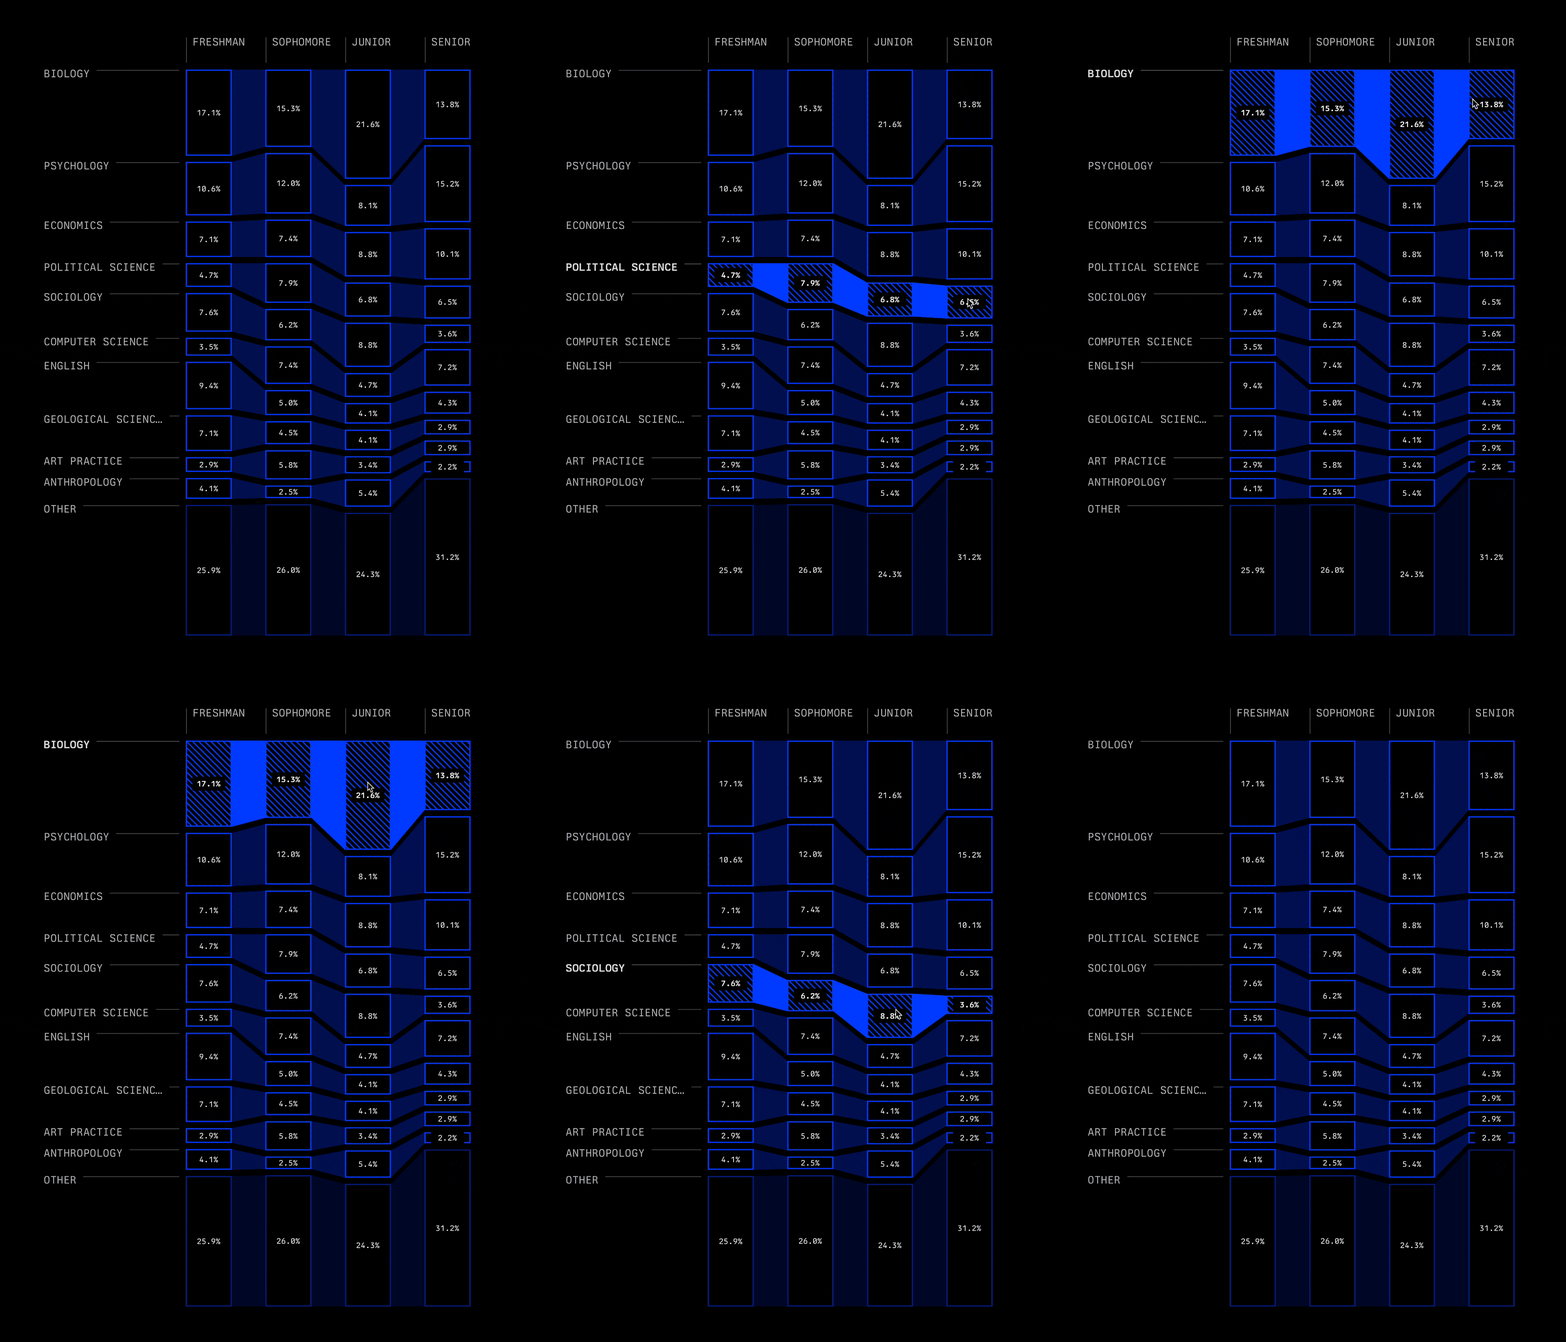
For this past school year, we designed a system by which unique graphics are generated for every school, tailored to the peculiarities and findings on its majors, class years, religious and political beliefs, gender differences, and more. For the overall look and feel of the aesthetic direction, we were inspired by retro video games.
For this past school year, we designed a system by which unique graphics are generated for every school, tailored to the peculiarities and findings on its majors, class years, religious and political beliefs, gender differences, and more. For the overall look and feel of the aesthetic direction, we were inspired by retro video games.
 Sample of an interactive graph
 Typography Explorations
  Evolution of data visualization on campus reports